Sierra Leone

Sierra Leone, Uncategorized

Freetown

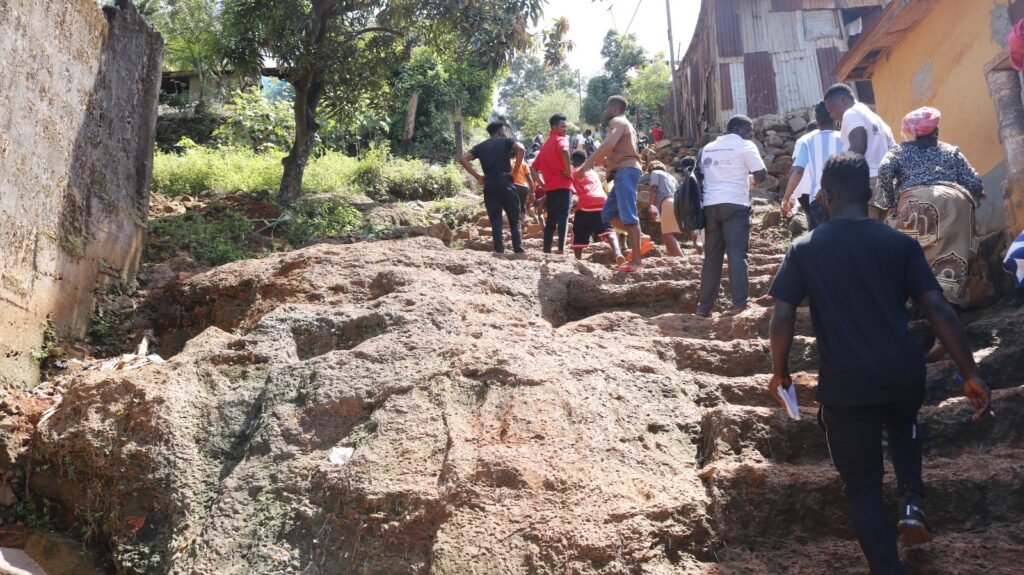
Freetown is the capital of Sierra Leone and a major port city. During the country’s civil war between 1991 to 2002, about 500,000 farming families were displaced in the country, many of them moving to Freetown, and continued to remain there. The migration accelerated urbanisation compounding infrastructure issues, forcing people to build informal settlements and communities. Much of this urbanisation is unplanned. The road network in the city covers just 5% of the city’s land compared to the recommended 30%. This increases climate-risk vulnerability for an already vulnerable population, especially those living in informal settlements or working in the informal sector. In 2017, flooding and mudslides in Freetown killed more than 500 people.  The Urban SHADE project will be working in Susan’s Bay, CKG and Moyiba. Susan’s Bay Susan’s Bay is a coastal settlement in the center of Freetown, which reflects a long history of British colonial rule in Sierra Leone. The settlement is believed to have been named after the wife of one of the British colonial governors in the early twentieth century. Susan’s Bay is a valuable harbour in the city that facilitates interior trade between Freetown residents and traders from coastal towns and villages in the north of Sierra Leone. The community continues to provide an important route for sea transportation of food items, including fruits and vegetables, fish, and firewood from across the Sierra Leone River into Freetown. Most residents, particularly women, are engaged in informal trade, which includes the sale of fish, charcoal, and other food items. Susan’s Bay is a valuable harbour in the city that facilitates interior trade between Freetown residents and traders from coastal towns and villages in the north of Sierra Leone. The community continues to provide an important route for sea transportation of food items, including fruits and vegetables, fish, and firewood from across the Sierra Leone River into Freetown. Most residents, particularly women, are engaged in informal trade, which includes the sale of fish, charcoal, and other food items. Susan’s Bay’s face changed after widespread internal migration during the war. There was rapid informal land reclamation, with houses built on ocean’s banks exposing residents to increased risks of flooding. The settlement is also at a risk of heatwaves and fire incidents.  Many houses are largely makeshift with corrugated iron sheet walls, lack good foundations, and are highly clustered, making them vulnerable to damage from yearly flooding and fire incidents. There are no access roads for vehicular entry, which impacts effective service delivery during emergencies, such as fire incidents. The lack of formal land deeds and building permits discourages housing improvement, with the fear of eviction. There is one community health centre delivering primary healthcare services. The overwhelming population and bad experiences with formal health service provision, such as long wait times, high cost, trust issues, and perceived poor quality of care, often make many residents turn to traditional healers or pepe doctors (informal drug sellers) before seeking formal care.  Common health conditions include malaria, typhoid, and cold, resulting from poor water sanitation conditions and proximity to the coastline.  CKG CKG is in the west of Freetown. It is an abbreviation used to describe a network of small coastal settlements built on the banks of the Congo river known as Crab town, Kolle town and Gray Bush. They are considered one community because of their proximity and similar social and environmental characteristics. It lies close to Kingtom dumpsite, one of the two largest dumpsites in Freetown. The settlement is believed to have started in the early 1970s when the National Stadium was constructed. The nearby vacant land became populated with people working on the construction of the stadium and those seeking livelihood opportunities. As migration to Gray Bush continued into the 1980s, people began to settle in the adjacent low-lying section of CKG called Crab Town, hunting crabs in the crocodile river. The coastal area near the Kingtom landfill was also reclaimed to form the other section of the community known as Kolleh Town.  After the civil war, an ensuing migration into Freetown increased overcrowding and congestion in the area. The presence of informal housing structures in waterlogged areas near the Kingtom landfill influences the recurrence of regular flooding and fire hazards, and increased air pollution.  The majority of the structures in Crab Town and Kolleh Town are made of corrugated iron sheets, while Gray Bush, sitting on top of Crab Town, largely comprises mud and cement brick structures. Livelihood activities of residents include fishing, small-scale businesses, and scavenging from the Kingtom dumpsite. Like many informal settlements in Freetown, the residents of CKG have limited public provision of good drinking water. Most of the sources are dug wells used for domestic purposes, but are unfit for drinking due to contamination, especially in the rainy season when the community floods. The other risks are heatwaves, and falling rocks and boulders. Limited pipe-borne water connected to the municipal grid is the main source of potable water, although it is also reported to be exposed to contamination in the event of flooding. The community also faces dire sanitation challenges. Residents at Crab town and Kolleh town, along the Congo River connect sewage pipes that empty sludge into the river. The lack of good drainage, poor waste management, and the existence of the Kingtom landfill at Kolleh town further exacerbate exposure of residents to health risks.  Moyiba Moyiba is a hillside informal settlement in the east of Freetown, about 5 km from the Central Business District. Established as a farming community in 1929, it was transformed into a quarry in 1966 to support major city infrastructure projects in Freetown, including roads, bridges, the national port and stadium. During the war, the settlement attracted many internally displaced persons and urban residents facing housing difficulties. The area is made of hills and has high levels of deforestation because of house construction and stone mining. (HISTORY) Housing The houses in Moyiba primarily are built with mud-brick walls and corrugated iron sheets, with a few makeshift structures,

Blog, Sierra Leone

When Communities Map Themselves, Policymakers Start to Listen

When Communities Map Themselves, Policymakers Start to Listen Geographic Information System (GIS) is a computer system for capturing, storing, analysing and displaying data that are spatially referenced to the earth. GIS is used to create maps, analyse patterns and identity relationships. GIS is increasingly used as a tool to help map informal settlements with respect to utilities, waste management, roads, infrastructure, among others. Richard Bockerie is a seasoned data and software development professional with over a decade of experience in advanced data collection, management, analysis, and mapping, specializing in community-driven research and climate resilience projects. Holding a degree in Computer Science, he has effectively led mapping and training initiatives across multiple African countries. As Programme and Technical Manager at the Centre of Dialogue on Human Settlement and Poverty Alleviation (CODOHSAPA), the Sierra Leone affiliate of Slum Dwellers International (SDI), Richard leverages cutting-edge data platforms and GIS technology to provide actionable insights that underpin climate adaptation strategies and sustainable development policies. His work centers on delivering reliable, high-quality data critical for research on climate change impacts, urban planning, and community resilience. With expertise in monitoring and evaluation, system development, and business analytics, Richard empowers stakeholders to make evidence-based decisions that enhance environmental sustainability and socio-economic well-being in vulnerable populations. Through his role, Richard contributes to global efforts addressing climate change challenges by bridging technological innovation with grassroots knowledge, strengthening capacities for informed climate action in the most affected regions. Richard spoke to Menaka Rao, Urban SHADE’s Project Communication Officer. These are the excerpts of the interview. Menaka: How did you first start using GIS mapping in informal settlements? Richard: We began using GIS in 2015. At that time, I was responsible for analysing data of  a household survey. While quantitative data provided valuable insights, I realised it did not capture the full reality on the ground. We needed a way to represent the data spatially for a clearer picture. “Unlike traditional reports filled with graphs and tables, a map resonates with people because they can see and identify their own neighborhoods, homes, and places of work. This connection empowers them to participate actively in planning and decision-making.“ For example, if I say 50% of households lack access to water points, that’s useful. But it’s even more actionable when I can pinpoint which specific zones those households are in. Mapping the data allows us to identify areas with high and low access to services. Another instance is when community members report exposure to flooding, landslides, and other hazards—GIS lets us locate exactly where these risks exist. It became clear that quantitative and qualitative data alone couldn’t tell the entire story. GIS tools became essential in supporting our evidence and enabling evidence-based decision-making. Maps make the data more relatable and understandable for communities. Unlike traditional reports filled with graphs and tables, a map resonates with people because they can see and identify their own neighborhoods, homes, and places of work. This connection empowers them to participate actively in planning and decision-making. Menaka: What can GIS mapping do to help us understand informal settlements? Richard: GIS has huge potential to help us understand informal settlements because these places exist in physical space. When we talk about land rights, access to services, or building infrastructure, we need to show exactly what is in that space—who owns what land, the size of the community, the number of buildings, and common risks like flooding or landslides. For example, if we want to help communities get land ownership, we need to clearly map the area so people can have official documents and title deeds for their land. That’s where GIS helps. GIS mapping also lets us see who has access to services and who doesn’t. I worked on a project in Freetown with the University of Chicago where we mapped the whole city’s access to essential services using the K block analysis. We found that areas closer to roads had better service than those without road access. This data helped city officials realise the problem. Because of this, the city started a project to build roads in Kroobay, a settlement in Freetown, which has made it easier to bring services to people there. So, GIS gives us clear evidence of challenges and opportunities, and when we show this to city leaders and government, they are more likely to take action. Menaka: You conduct GIS exercises with community researchers.  Can you help us understand with examples how GIS helps community members understand their own locality better? What insights do they get when they do this exercise? Richard: In participatory GIS, community members create maps of their settlement themselves, instead of outsiders doing the mapping for them. This process helps them understand their community deeply. For example, we take drone images, print them, and bring them to the community. We first explain the images and then ask them to mark important places on the map. They mark where they live, work, and parts of the settlement prone to hazards like flooding. In one exercise, we asked them to show where they dispose of waste and then identify flooding areas. They clearly saw the link between waste disposal and flooding. This helps them realize how daily actions affect everyone in the community. Menaka: Can you also give me an example about how the understanding about a particular settlement has changed after the use of GIS and how it can help identify issues that can be worked on by policy makers and other stakeholders.  Richard: And I’ll give you an example of one of Moyiba in Freetown, where the Urban SHADE project is working. When we started doing the GIS mapping, we understood that whenever it rains, the access to the committee is completely cut off because of the road network. You can’t access health facilities or any emergency services. Moyiba is a hillside settlement. We were able to draw the conclusion that the rain comes from top and slopes downwards. We could tell the community that we need to pave

Scroll to Top