Lessons from margins: Insights from visit to Shimla’s Krishna Nagar
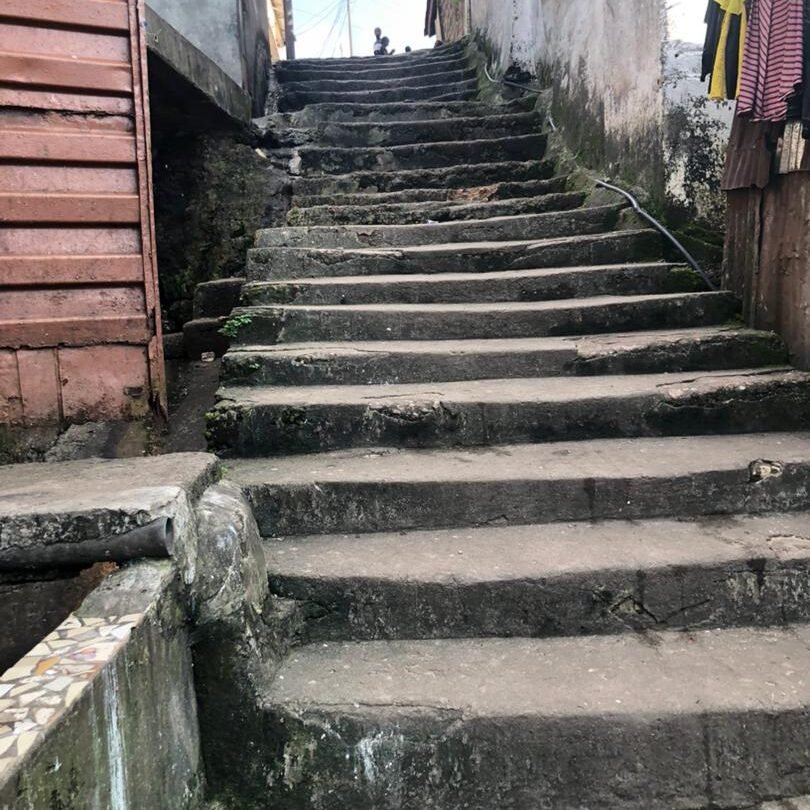
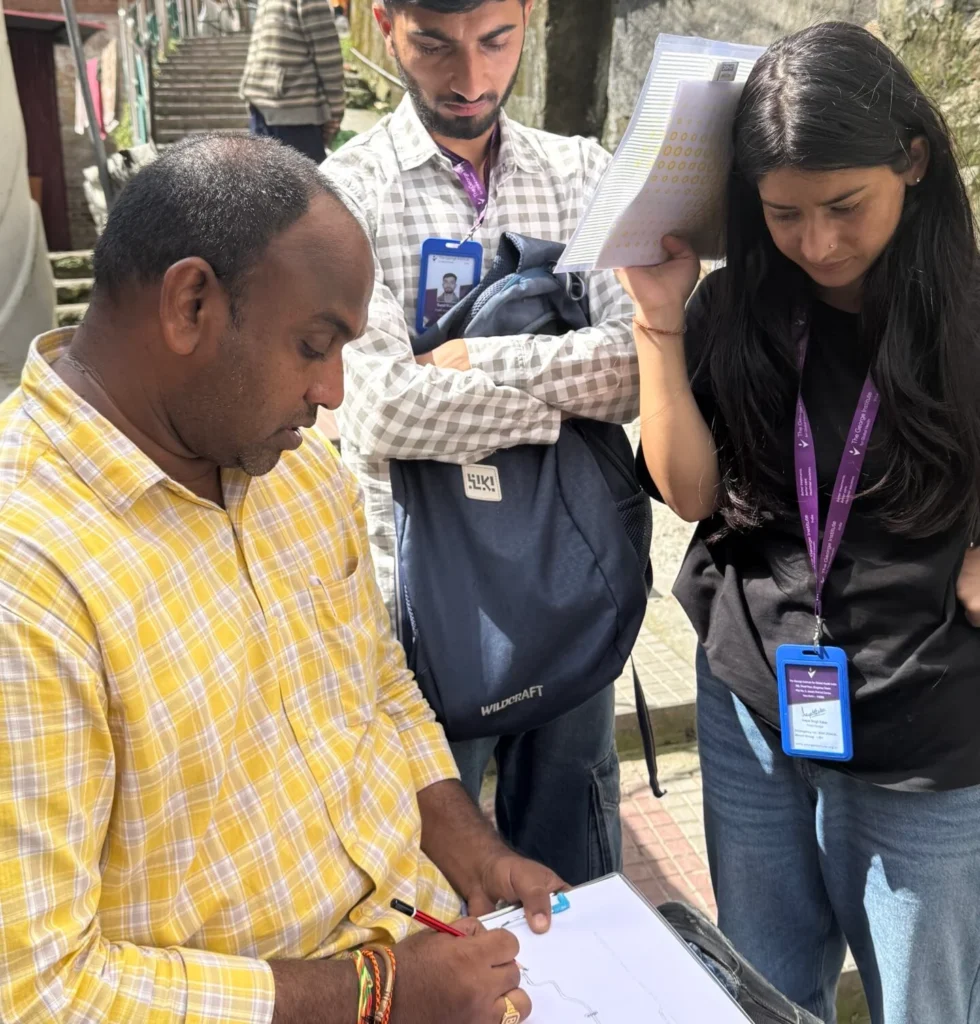
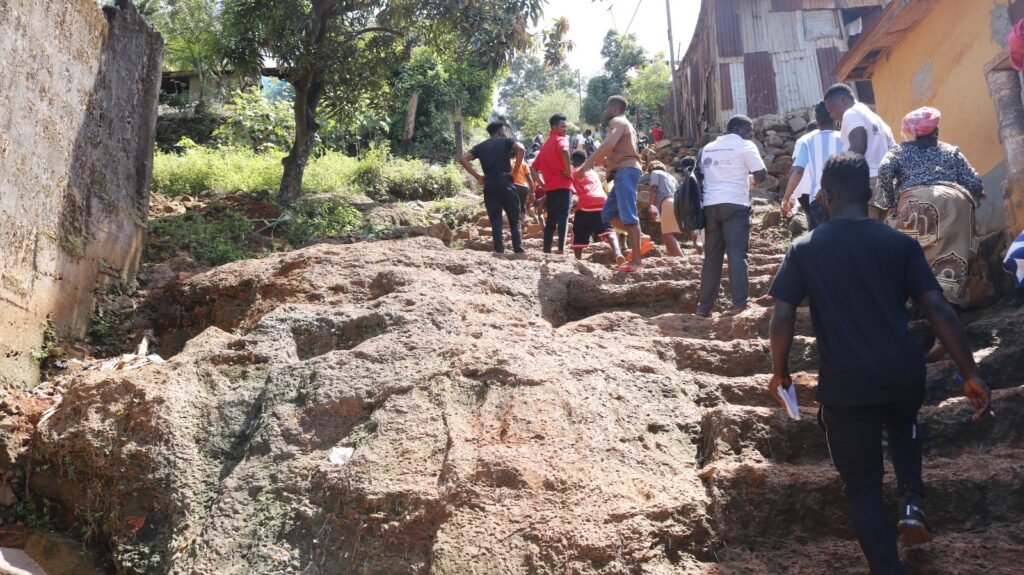
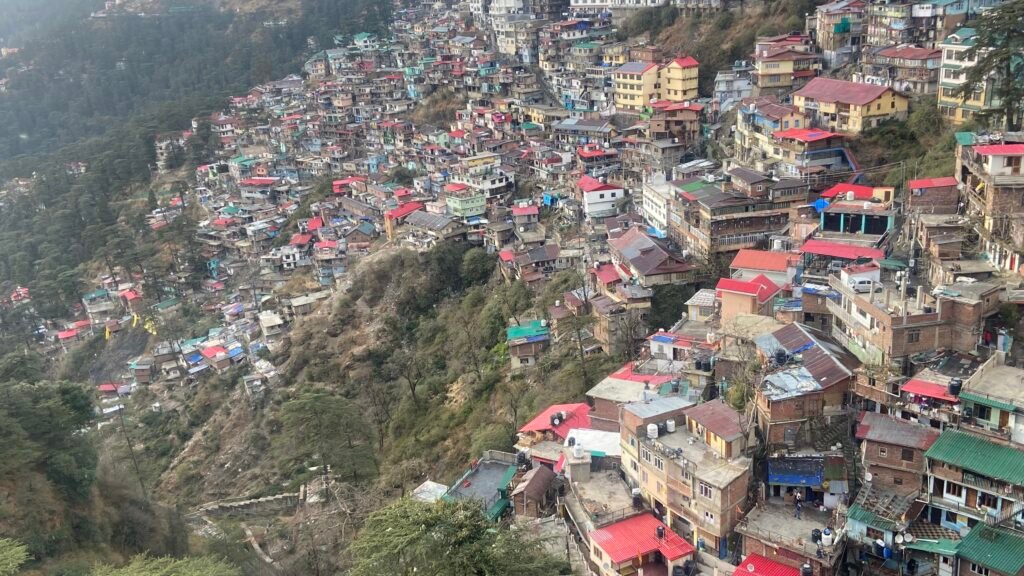
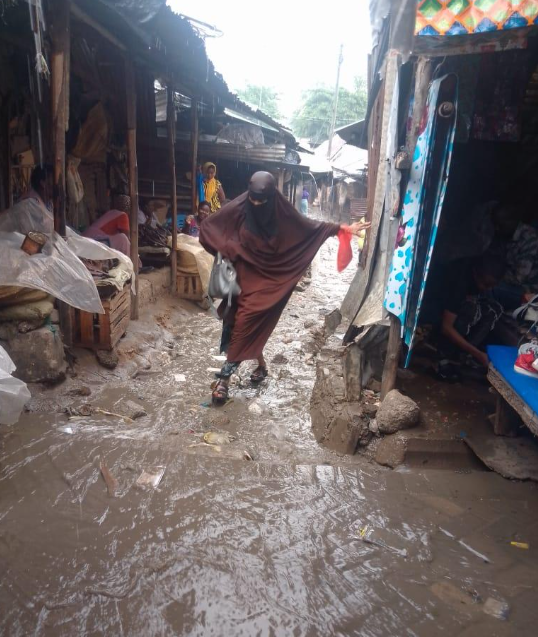
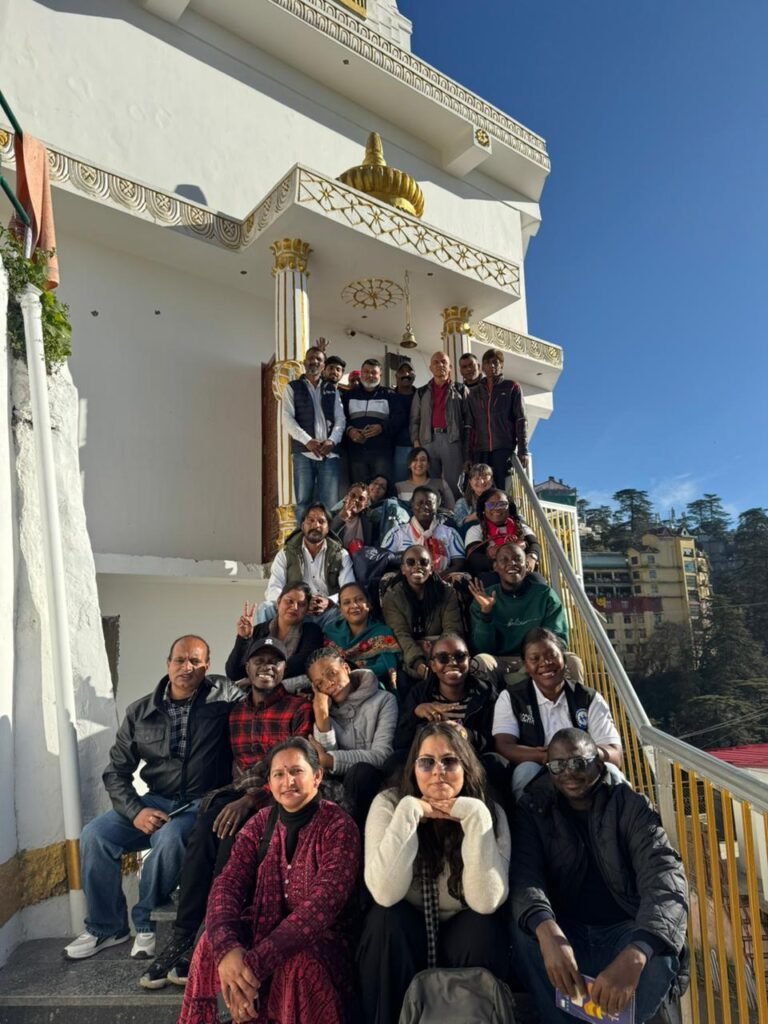
Lessons from margins Insights from Urban SHADE team visit to Shimla’s Krishna Nagar Looking at the paved roads and cemented houses at the beginning of Krishna Nagar settlement in Shimla, the first reaction of Urban SHADE members from Sierra Leone and Kenya was- “This place does not look like an informal settlement.” Krishna Nagar is an informal settlement at the heart of Shimla city. The Urban SHADE consortium visited Krishna Nagar during the Annual General Body Meeting on November 30. The consortium members were first trying to size up the differences and similarities between their field sites and Krishna Nagar. The settlement was built during the colonial times to house waste workers and other labourers. People in Krishna Nagar do not have land tenure. “The structures in Krishna Nagar looked stronger. The houses in our settlements are not as strong. In fact, even with a bit of heavy wind, the houses can be destroyed,” said Tena Kabba from Institute of Gender and Children’s Health Research (IGCHR) in Sierra Leone, which works with three informal settlements in Freetown for the project. The consortium members from Sierra Leone felt that Krishna Nagar with its steep slopes and steps resembled Moyiba a little. But as the members walked down towards the lower part of the settlement which is right at the edge of the hill, the challenges became apparent. Though the houses look well taken care of, some of them even have a small garden in front of them, many of them have big cracks. “My first thought was, is this really an informal settlement?,” said Michelle Koyaro from Slum Dwellers International, Kenya. “We then saw the housing conditions. The walls of many houses are full of cracks. It places them in a vulnerable state. They are not sure if they will be able to live in the house next monsoon. I realised that if someone does not know the context definition of informal settlement, they will quickly cancel Krishna Nagar as informal settlement. ” And indeed, many houses have collapsed at the edge of the hill during the 2023 landslide when the Slaughterhouse collapsed. The consortium members met a man who sent his family to his native place but continued to live in a house perched at the edge of the hill. He said he had no option because he had to make a living in Shimla. What struck many Urban SHADE members is how much people invested in the houses. The houses are by and large cemented, and many have taken effort to even have a garden in a small strip of land. The roads in the upper part of the settlement were built by the municipal authorities. The consortium members then saw older persons trying to walk up the stairs, as well as houses with big cracks perched precariously at the extreme lower part of the settlement, at huge risk of being washed out by rains. Dr Jiban Karki, from Liverpool School of Tropical Medicine (LSTM) said that the lower parts of the settlement were revealing. “I visited Krishna Nagar twice. But this time we went further down, where we saw all the cracked houses. We found that people were still living there despite the danger. There was another vulnerable population who were living in rented houses. Towards the top of the hill in Krishna Nagar people were relatively better off, then those in the lower range.” Dr Karki spoke about meeting some Nepali origin people in the lower parts of the settlement who lived on rent, in houses that were more precarious. As the consortium members tried to climb up the stairs they realised how difficult it is. ”I kept thinking about how many elderly people live there. As young as I am, I was barely able to climb the stairs. Even if there is a car available, it is hard to get to the main road,” said Dr Desta Ali, from IGCHR. Many wondered how pregnant persons and those with disabilities climb stairs everyday. Some of the Urban SHADE team members met an elderly lady who had great difficulty climbing a steep flight of stairs. She took breaks sitting down at the side of the stairs while walking up with a stick.She sought help from some teenagers passing by. The consortium also saw the building of the primary health centre (PHC) which is currently non-functional. The older PHC which was there earlier collapsed more than a decade ago during the monsoon. The team from Sierra Leone and Kenya observed that they had a functional health facility within most of their settlements they are working with for the Urban SHADE project. The ASHA workers present in the meeting also raised various problems people in the community faced because of PHC. Dr Ijeoma Onyeahialam, who works with LSTM observed, “In relation to Sustainable Development Goals (SDG), the community falls short because of the community’s lack of access to health care. The PHC is not working. After going into the community more, you can see how pregnant women are disadvantaged. This also helps various country teams to see how they can compare and see similarities.” The consortium members also had a meeting with community leaders and ASHA workers at Valmiki temple said to have been established in the early 1900s. Valmiki is a patron saint for Dalits. The discussions ranged from lack of land tenure, caste discrimination and access to healthcare. The community leaders of Krishna Nagar spoke about how the government keeps trying to evict them, as it falls on prime land. “Just before the elections, the political leaders promise that they will ensure we will be granted land tenure. But after elections, these promises vanish,” said Kuldeep, who is with the Valmiki Sabha The teams from Sierra Leone and Kenya said that it’s just the same situation in their hometowns with informal settlements. Except, the people working in the settlements there refrain from investing their money in building a better house because of the fear of eviction. “People