When Communities Map Themselves, Policymakers Start to Listen
Geographic Information System (GIS) is a computer system for capturing, storing, analysing and displaying data that are spatially referenced to the earth. GIS is used to create maps, analyse patterns and identity relationships. GIS is increasingly used as a tool to help map informal settlements with respect to utilities, waste management, roads, infrastructure, among others.
Richard Bockerie is a seasoned data and software development professional with over a decade of experience in advanced data collection, management, analysis, and mapping, specializing in community-driven research and climate resilience projects. Holding a degree in Computer Science, he has effectively led mapping and training initiatives across multiple African countries.
As Programme and Technical Manager at the Centre of Dialogue on Human Settlement and Poverty Alleviation (CODOHSAPA), the Sierra Leone affiliate of Slum Dwellers International (SDI), Richard leverages cutting-edge data platforms and GIS technology to provide actionable insights that underpin climate adaptation strategies and sustainable development policies.
His work centers on delivering reliable, high-quality data critical for research on climate change impacts, urban planning, and community resilience. With expertise in monitoring and evaluation, system development, and business analytics, Richard empowers stakeholders to make evidence-based decisions that enhance environmental sustainability and socio-economic well-being in vulnerable populations.
Through his role, Richard contributes to global efforts addressing climate change challenges by bridging technological innovation with grassroots knowledge, strengthening capacities for informed climate action in the most affected regions.

Richard spoke to Menaka Rao, Urban SHADE’s Project Communication Officer. These are the excerpts of the interview.
Menaka: How did you first start using GIS mapping in informal settlements?
Richard: We began using GIS in 2015. At that time, I was responsible for analysing data of a household survey. While quantitative data provided valuable insights, I realised it did not capture the full reality on the ground. We needed a way to represent the data spatially for a clearer picture.
“Unlike traditional reports filled with graphs and tables, a map resonates with people because they can see and identify their own neighborhoods, homes, and places of work. This connection empowers them to participate actively in planning and decision-making.“
For example, if I say 50% of households lack access to water points, that’s useful. But it’s even more actionable when I can pinpoint which specific zones those households are in. Mapping the data allows us to identify areas with high and low access to services. Another instance is when community members report exposure to flooding, landslides, and other hazards—GIS lets us locate exactly where these risks exist.
It became clear that quantitative and qualitative data alone couldn’t tell the entire story. GIS tools became essential in supporting our evidence and enabling evidence-based decision-making. Maps make the data more relatable and understandable for communities. Unlike traditional reports filled with graphs and tables, a map resonates with people because they can see and identify their own neighborhoods, homes, and places of work. This connection empowers them to participate actively in planning and decision-making.
Menaka: What can GIS mapping do to help us understand informal settlements?
Richard: GIS has huge potential to help us understand informal settlements because these places exist in physical space. When we talk about land rights, access to services, or building infrastructure, we need to show exactly what is in that space—who owns what land, the size of the community, the number of buildings, and common risks like flooding or landslides.
For example, if we want to help communities get land ownership, we need to clearly map the area so people can have official documents and title deeds for their land. That’s where GIS helps.
GIS mapping also lets us see who has access to services and who doesn’t. I worked on a project in Freetown with the University of Chicago where we mapped the whole city’s access to essential services using the K block analysis. We found that areas closer to roads had better service than those without road access. This data helped city officials realise the problem. Because of this, the city started a project to build roads in Kroobay, a settlement in Freetown, which has made it easier to bring services to people there. So, GIS gives us clear evidence of challenges and opportunities, and when we show this to city leaders and government, they are more likely to take action.
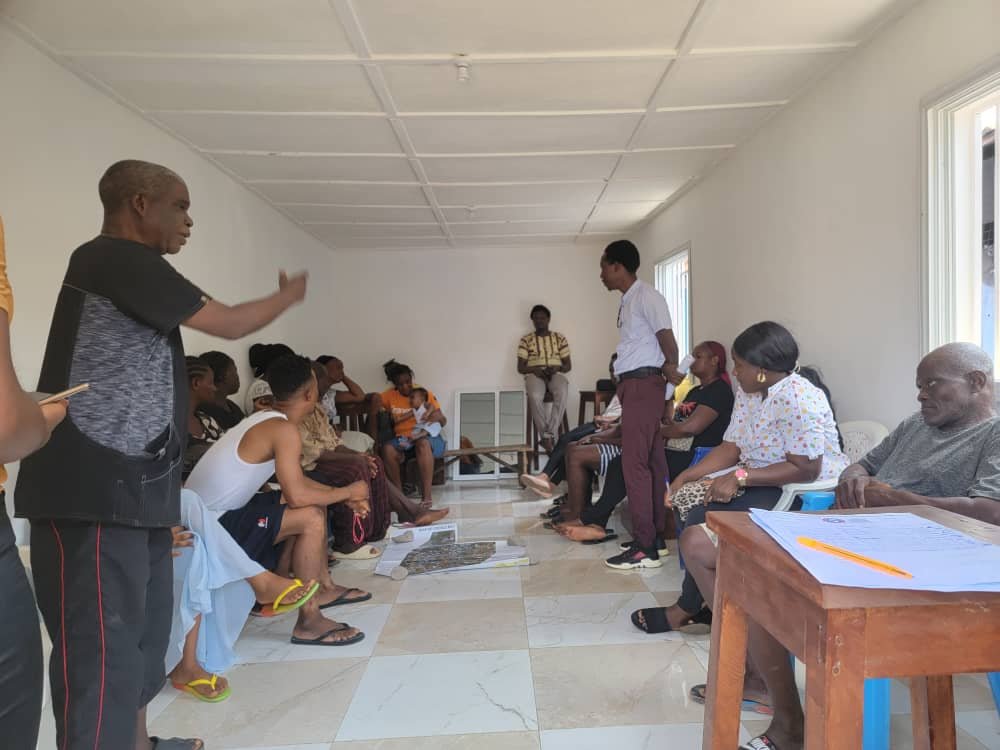
Menaka: You conduct GIS exercises with community researchers. Can you help us understand with examples how GIS helps community members understand their own locality better? What insights do they get when they do this exercise?
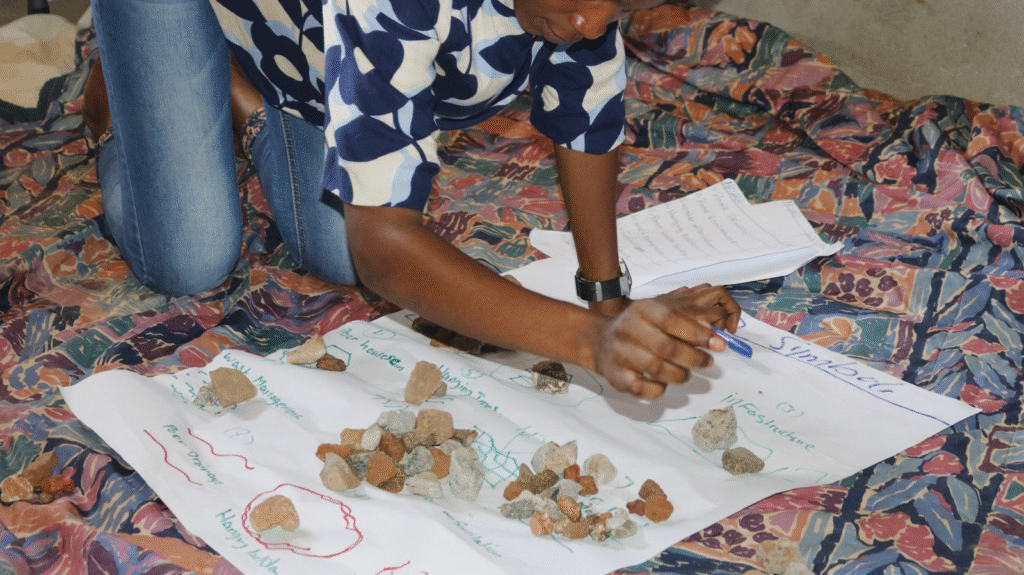
Richard: In participatory GIS, community members create maps of their settlement themselves, instead of outsiders doing the mapping for them. This process helps them understand their community deeply.
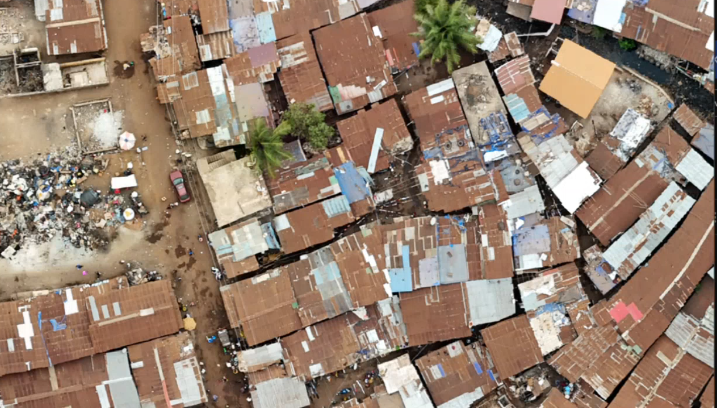
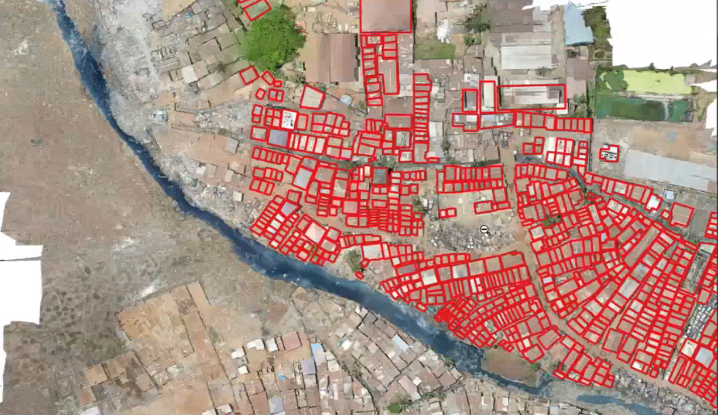
For example, we take drone images, print them, and bring them to the community. We first explain the images and then ask them to mark important places on the map. They mark where they live, work, and parts of the settlement prone to hazards like flooding.
In one exercise, we asked them to show where they dispose of waste and then identify flooding areas. They clearly saw the link between waste disposal and flooding. This helps them realize how daily actions affect everyone in the community.
Menaka: Can you also give me an example about how the understanding about a particular settlement has changed after the use of GIS and how it can help identify issues that can be worked on by policy makers and other stakeholders.
Richard: And I’ll give you an example of one of Moyiba in Freetown, where the Urban SHADE project is working. When we started doing the GIS mapping, we understood that whenever it rains, the access to the committee is completely cut off because of the road network. You can’t access health facilities or any emergency services. Moyiba is a hillside settlement. We were able to draw the conclusion that the rain comes from top and slopes downwards. We could tell the community that we need to pave a road right up to the hill to address this need.
Moyiba settlement has been identified as one of the areas for the Resilient Urban Sierra Leone Project (RUSLP). They are working on critical infrastructure such as roads, and drainages towards addressing those needs that we identified on the map.
Another settlement we mapped was Susan’s Bay. It’s one of the communities that is very hard to navigate. They only have footpaths. In any type of disaster, it is difficult to evacuate people. So, through the mapping exercise, we mapped out safe routes and made evacuation centres. We have printed these maps and took them back to communities. We trained them on how to read and use them. And they have been using them. A community member now knows the easiest route if there is a chair or a big television that needs to be taken out of the house during an emergency. So, mapping brings this kind of understanding in the community.
“In participatory GIS, community members create maps of their settlement themselves, instead of outsiders doing the mapping for them. This process helps them understand their community deeply…In one exercise, we asked them to show where they dispose of waste and then identify flooding areas. They clearly saw the link between waste disposal and flooding. This helps them realize how daily actions affect everyone in the community.“
Menaka: What do you think are the implications of GIS mapping for this Urban SHADE study?
Richard: I’ll give you three contexts. One, we are looking at, access to health services during extreme weather conditions. We need to understand what the limitations are and what needs to happen for access to improve. GIS plays a critical role in all of those things. Firstly, we’ve started by mapping out the settlement boundaries, and then we have mapped out the services. We are currently mapping out all of the road network including footpath and informal roads. This is to understand how we can improve access to health facilities. GIS mapping exercises will be able to enable us to translate the research processes into actionable outcomes.
“When we started by mapping out all the informal settlements in the city, we also mapped out their contribution. We were able to communicate that 70% of the people living in informal settlements work in formal settings. ..That’s how the mindset of the government started to slowly move from forced eviction to a more participatory approach in terms of upgrading informal settlements. It’s slowly paying off.“
Menaka: How has GIS mapping so far helped you in advocacy?
Richard: I’ll give you one example clearly. On Monday, Sierra Leone passed a new National Town and Country Planning Act on August 11. The Act recognises informal settlements.
With the GIS work, we were able to show that we have 70 odd informal settlements in Freetown. We could tell them where they are located, their land boundary, and the services available to them. That was how we started the advocacy. Before 2015, when you mentioned informal settlement, all the government was interested in eviction. They would say these people should not reside there, and they are causing a lot of problems. But when we started by mapping out all the informal settlements in the city, we also mapped out their contribution. We were able to communicate that 70% of the people living in informal settlements work in formal settings. And they are living there because of proximity to the business district and livelihood opportunities. We were able to demonstrate that on a map. That’s how the mindset of the government started to slowly move from forced eviction to a more participatory approach in terms of upgrading informal settlements. It’s slowly paying off.
We started the process of advocating for a new town and country planning Act. Because the land laws are very old. From 1946. We have always been saying that these laws do not adequately make provision for informal settlements. We were advocating that we need to review these laws as they do not reflect the current reality.
Ten years down the line, we have a new National Town and Country Planning Act that has been enacted by the House of Parliament into law, recognizing these places and ensuring that Freetown City Council and other councils provide essential services for them. This is a huge gain.
Menaka: Oh, that’s great news. Congratulations! Thank you for giving time for the interview.